You are here
Skills Gaps

|

|
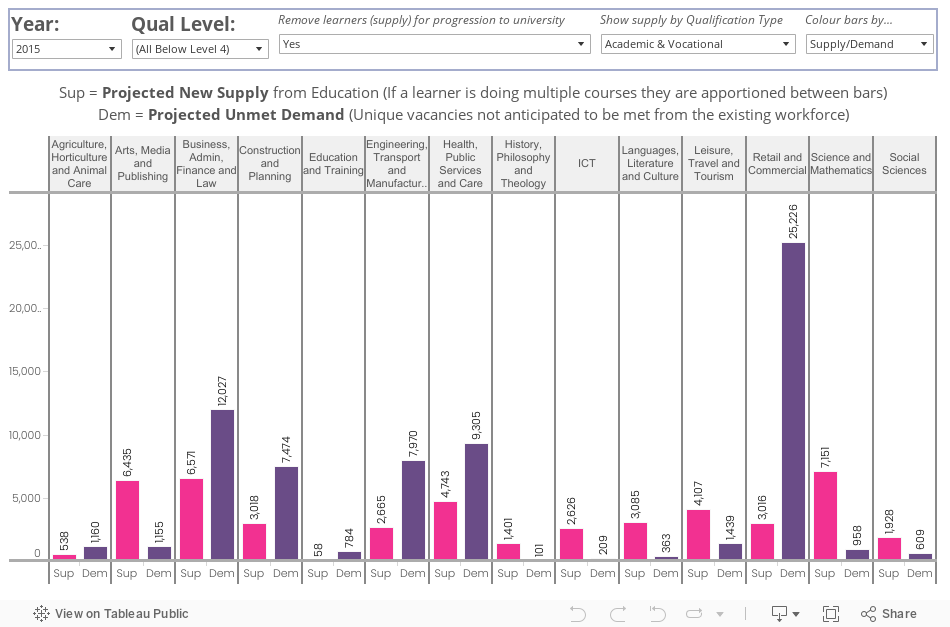
The analysis shows forecasts of learners successfully completing courses in different subject areas, compared with the vacancies linked to those subject areas, for courses and jobs at Level 3 and below.
Each pair of bars in each of the subject areas shows the projected number of new 17 and 18 year olds available to the labour market (having successfully completed a course) compared with the projected number of vacancies in occupations linked to those subjects.
Where the supply bar is lower than the demand bar in a particular subject area, the analysis suggest that there are not enough people coming from education to meet the demand for future jobs in related occupations (so the demand would be met from outside of London, including overseas, met by people retraining from other courses, or not met at all). Where the supply bar is higher than the demand bar, the analysis suggests that too many young people are studying that subject given projected future jobs in London.
Note that demand for some occupations is split between a number of subjects, so ensure you view the full range of subject areas (by clicking on the bars).
In some cases, although there may be limited demand at level 3 and below, there will be significant demand at higher levels (i.e. for learners with degree level qualifications)
- Click a bar to drill-down into the individual subjects within the overarching subject area
- Use the drop-downs above the chart to change the year of projections shown (up to 2020) or to breakdown the analysis by the level of qualification.
- “Remove learners for progression to education” reduces the projected supply from Level 3 courses on the assumption that 66% of academic Level 3 learners and 43% of vocational Level 3 learners go on to Higher Education. We recommend you remove Level 3 learners progressing to HE as these are likely to be achieving Level 4 or higher qualifications later on and the analysis only shows jobs at below Level 4.
- Choose whether to colour the bars by the subject area, supply and demand bars, or to split the supply bar into vocational or academic courses
- Use the “Filter Qualification Type” drop-down to choose to exclude vocational or academic qualifications. Vocational qualifications can be a better way of comparing to job vacancies in some sectors.
The demand analysis is based on labour market growth projections from UKCES (which create job vacancies), as well as an element of “replacement demand” (people that leave the sector and require replacing) in each sector. Click to see more on the demand modelling approach used.
Supply data (i.e. number of people successfully completing courses) is produced by looking at the historical trends of data in different subjects and levels, and projecting these forward. Learners are tied to a local authority by their place of residence, rather than where they studied. Click to see more on the supply modelling approach used.
Jobs are matched to curriculum subjects that are linked to them using a mapping algorithm tested by a steering group.
Please make sure you understand the caveats involved in this analysis before using it to provide advice and guidance. Click here to see full list of caveats.